Acumatica process flow dashboards provide the ability to include HTML widgets, so that you can link to internal pages and external sites. This capability demonstrates the advantage of using a web-based ERP system.
In this article, I will describe how you can create the following:
- A process flow dashboard linking to specific areas inside the Acumatica application
- A dashboard article that links to an external system

Scenario 1: Creating a Process Flow Dashboard with Internal Links
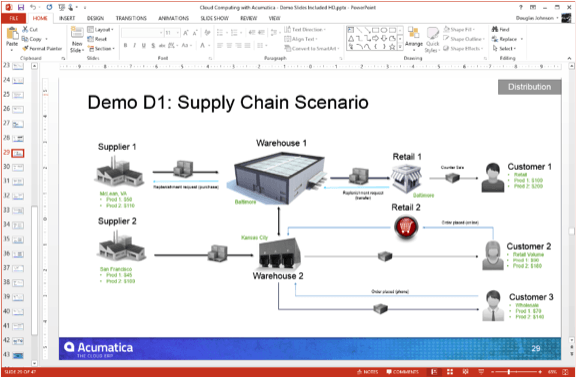
In this section, we create a dashboard that displays a flow diagram like the one illustrated below.
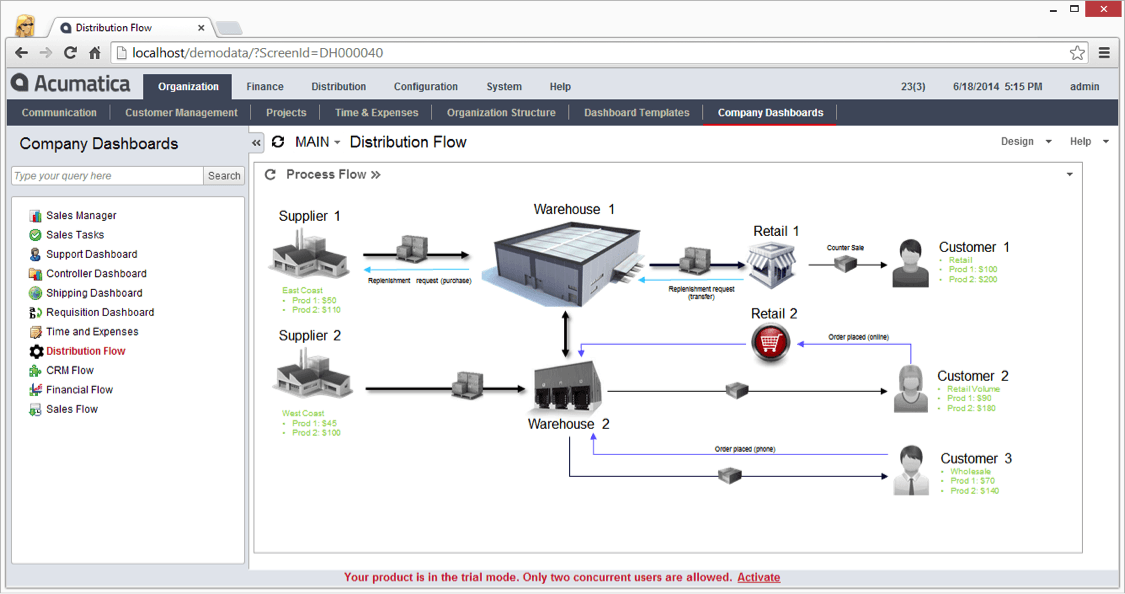
The individual icons in the diagram can be linked to specific screens inside Acumatica. For example, clicking on the Warehouse 1 picture links you to the warehouse screen inside Acumatica that shows information about warehouse 1. In this case, we open a new tab so you can review what you want to see, then close the tab to return to your process flow diagram.
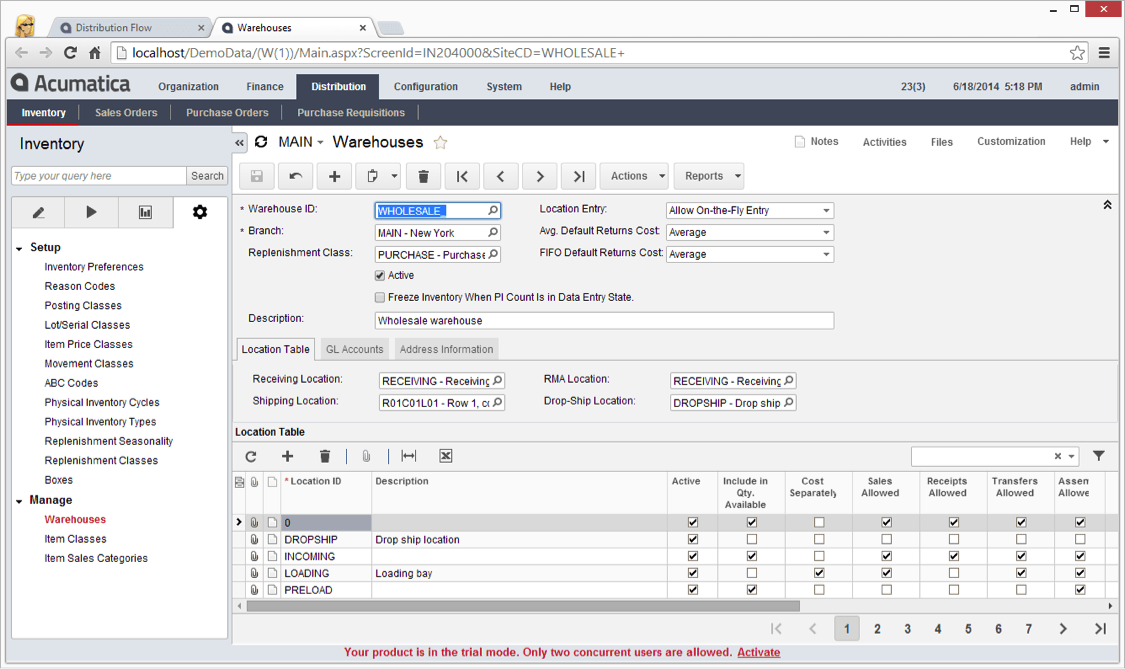
The process for doing this takes advantage of a new feature that was added to Acumatica 4.2. This feature is the ability to link to specific screens by specifying a screen ID as well as a specific record by specifying the key parameter on the screen. In this case, the key parameter is the warehouse ID.
So, we can dissect our URL as follows:
http://localhost/demodata/?ScreenId=IN204000&SiteCD=WHOLESALE+
- The blue section links to the application site. In many cases this can be replaced with “..” to make your code more portable.
- The green section links to the specific screen (warehouse in this case)
- The orange section links to the specific warehouse
If the third section is not included, then the link takes you to the warehouse screen without retrieving a specific warehouse.
Step 1: Create the image for your flow diagram
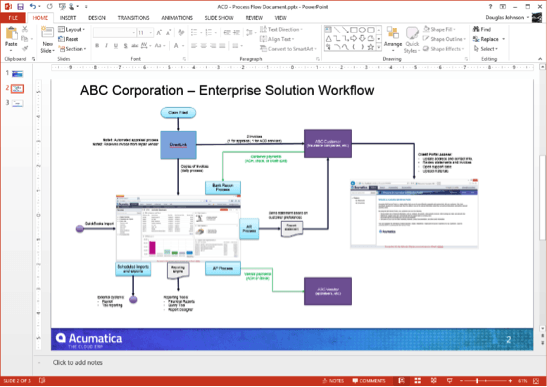
The first step is to create an image for your flow diagram. In this case, I utilized Microsoft PPT to create the image using stock art. Include images, text, or anything else you need to portray your process. I provided a couple examples below, but you can build anything to match your process.
Step 2: Create a wiki page for your dashboard
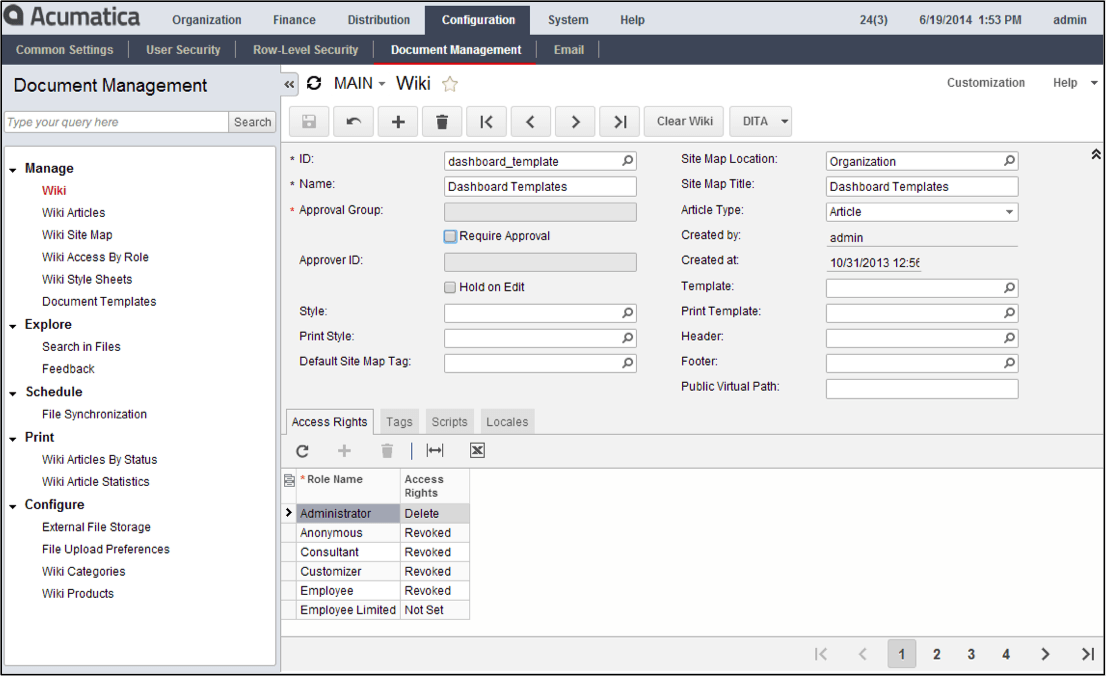
Here are the steps involved with creating a new wiki page to hold your dashboards. If you already have a wiki, then you can bypass this step.
- Navigate to Configuration > Document Management > Manage > Wiki
- Click “+” to create a new wiki
- Complete information and add to your site map. The image below is the example that I created.
Step 3: Create a new wiki article and add your image
Follow the steps below to create a new wiki article that will include your image.
- Navigate to the location in your site map where you added the wiki in step 2
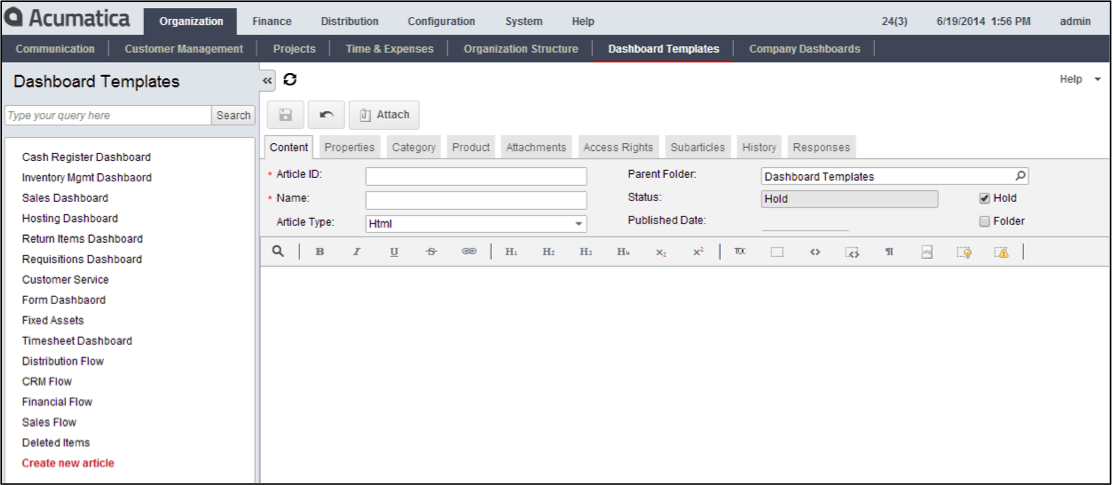
- Click the ‘Create new article’ option. In the screen shot below, I have already added several articles, so the ‘create new article’ option appears at the bottom of the list.
-
- Add an article ID and a name
- Select Html for Article Type. This is important, because the wiki markup language does not support the image map construct that we will be using.
- Click the attach button to add the image that you created with your flow diagram.
- After attaching the image, navigate to the ‘attachments tab,’ highlight the file you attached, and click the ‘get link’ button. Copy the ‘external link’ URL from the pop-up box.
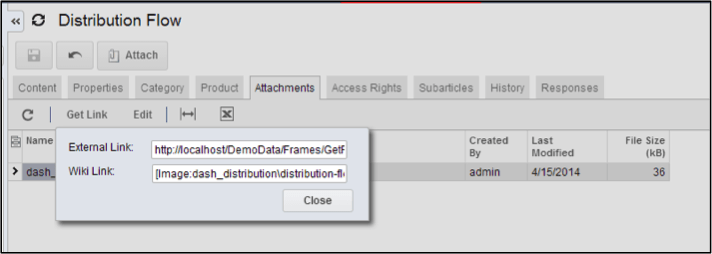
- Paste the code below into the content tab of your wiki article. Use the reference from your external link to reference the image.
- Note 1: the code in the screen shot below is included as an appendix to this article, so you can cut/paste.
- Note 2: discussion of the html code and the image map is provided in the following section
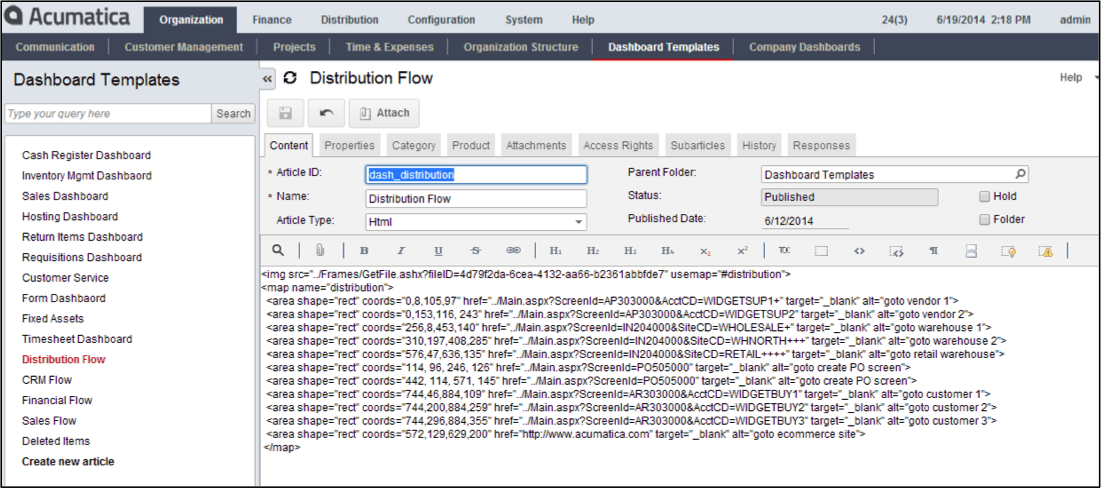
Step 4: Finalize the code for your wiki article
You can create the image map by using the HTML construct for mapping images.
<img src=”link to image” usemap=”#mymap”>
<map name=”mymap”>
<area shape=”rect” coords=”0,8,105,97″ href=”url you want to link to” target=”_blank” alt=”goto vendor 1″>
</map>
By specifying multiple areas and links, you can link to various places in your application. You can include three shapes (circle, rect, poly) defined in the html map function. For reference, visit http://www.w3schools.com/tags/tag_area.asp.
After you have defined all of the mappings, you can update the code provided.
Alternate method
If you have access to a web program such as Adobe Dreamweaver, you can use the interface to quickly create the mapping code defined in the prior section. Dreamweaver allows you to point and click to define regions and links in order to significantly speed the process and reduce the likelihood of errors. Sample below.
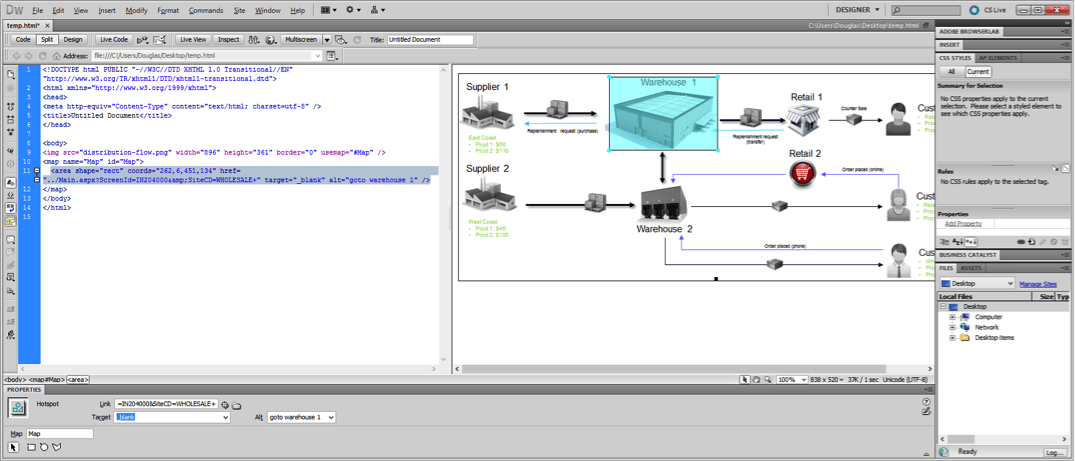
In this case, I can open the code Dreamweaver creates and paste it into my wiki article.

Step 5: Add wiki to dashboard
After saving your wiki article, navigate to the upper right corner of your article, and click the ‘add wiki’ button. This will insert the wiki on the dashboard that you have selected.
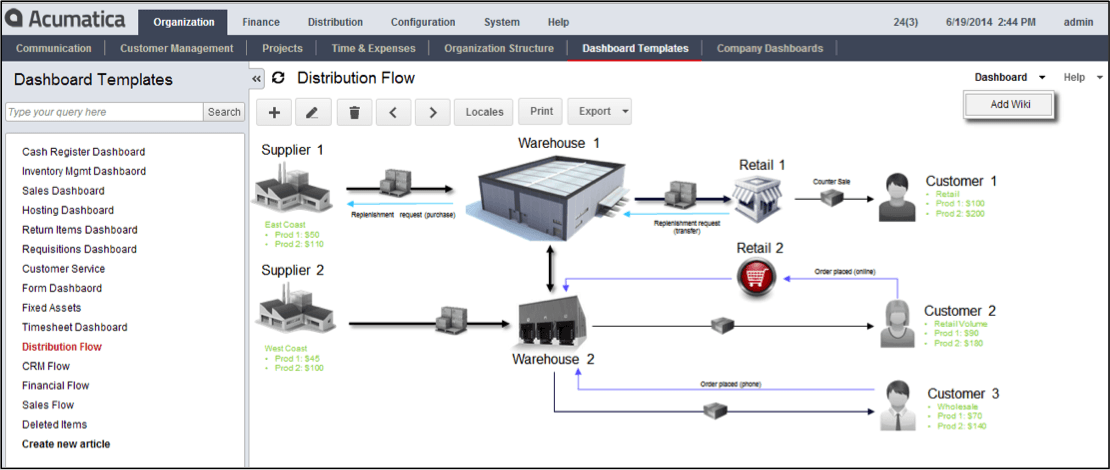
After adding the article to the dashboard, you can navigate to the dashboard and resize the article.
Scenario 2: Creating a Process Flow Dashboard Linking to an External System
The HTML construct can also be used to bring in an external website to an Acumatica process flow dashboard. This is useful for using Acumatica as a portal into other systems.
Step 1: Create a wiki page for your dashboard
These are the same steps provided for step 2 of the first scenario.
- Navigate to Configuration > Document Management > Manage > Wiki
- Click “+” to create a new wiki
- Complete information and add to your site map. The image below is the example that I created.
Step 2: Create dashboard code
The iframe construct provides a way to embed videos and pages from other websites in your Acumatica dashboard. Let’s assume we have a YouTube video that we want to publish in a dashboard. Our task with YouTube is easy because YouTube provides the embed codes.
- Open YouTube, select a video
- Click share, embed, and then copy the code
- Paste the code into your Acumatica wiki page
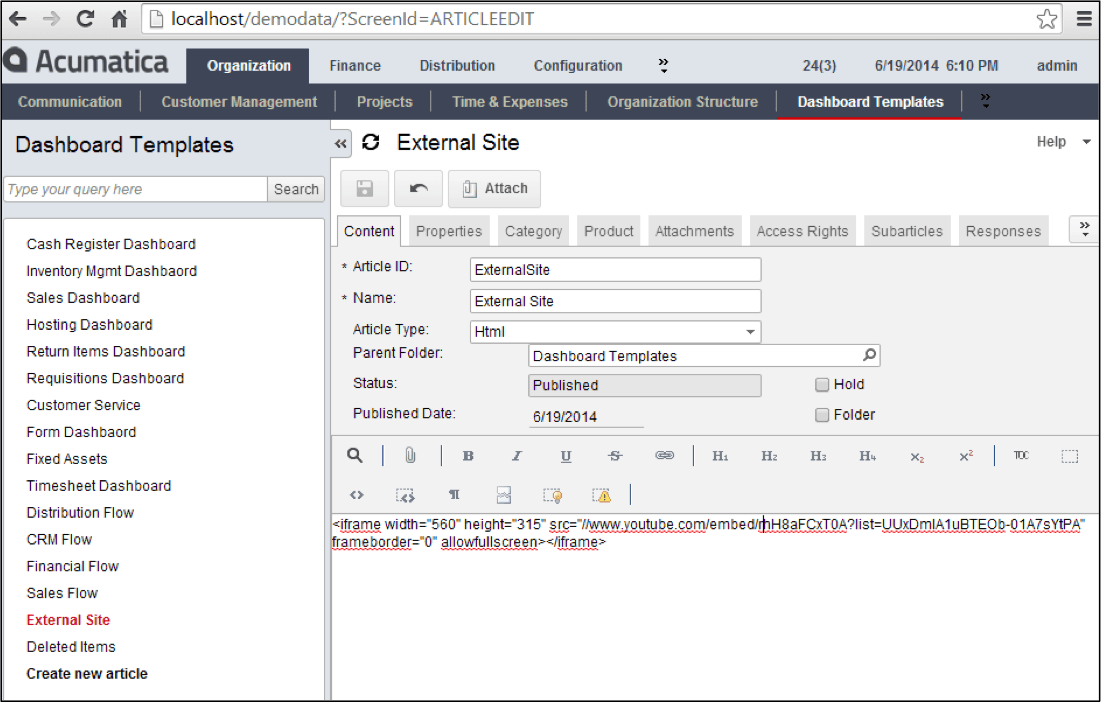
- Click the dashboard to add the video (or other web-page) to a dashboard. In this case, I added my instructional video about Purchase Order Management to the Purchase Order dashboard.
APPENDIX 1: Code for Wiki Article
Complete code:
<img src=”../Frames/GetFile.ashx?fileID=4d79f2da-6cea-4132-aa66-b2361abbfde7″ usemap=”#distribution”>
<map name=”distribution”>
<area shape=”rect” coords=”0,8,105,97″ href=”../Main.aspx?ScreenId=AP303000&AcctCD=WIDGETSUP1+” target=”_blank” alt=”goto vendor 1″>
<area shape=”rect” coords=”0,153,116, 243″ href=”../Main.aspx?ScreenId=AP303000&AcctCD=WIDGETSUP2″ target=”_blank” alt=”goto vendor 2″>
<area shape=”rect” coords=”256,8,453,140″ href=”../Main.aspx?ScreenId=IN204000&SiteCD=WHOLESALE+” target=”_blank” alt=”goto warehouse 1″>
<area shape=”rect” coords=”310,197,408,285″ href=”../Main.aspx?ScreenId=IN204000&SiteCD=WHNORTH+++” target=”_blank” alt=”goto warehouse 2″>
<area shape=”rect” coords=”576,47,636,135″ href=”../Main.aspx?ScreenId=IN204000&SiteCD=RETAIL++++” target=”_blank” alt=”goto retail warehouse”>
<area shape=”rect” coords=”114, 96, 246, 126″ href=”../Main.aspx?ScreenId=PO505000″ target=”_blank” alt=”goto create PO screen”>
<area shape=”rect” coords=”442, 114, 571, 145″ href=”../Main.aspx?ScreenId=PO505000″ target=”_blank” alt=”goto create PO screen”>
<area shape=”rect” coords=”744,46,884,109″ href=”../Main.aspx?ScreenId=AR303000&AcctCD=WIDGETBUY1″ target=”_blank” alt=”goto customer 1″>
<area shape=”rect” coords=”744,200,884,259″ href=”../Main.aspx?ScreenId=AR303000&AcctCD=WIDGETBUY2″ target=”_blank” alt=”goto customer 2″>
<area shape=”rect” coords=”744,296,884,355″ href=”../Main.aspx?ScreenId=AR303000&AcctCD=WIDGETBUY3″ target=”_blank” alt=”goto customer 3″>
<area shape=”rect” coords=”572,129,629,200″ href=”http://www.acumatica.com” target=”_blank” alt=”goto ecommerce site”>
</map>
 Canada (English)
 Colombia
 Caribbean and Puerto Rico
 Ecuador
 India
India
 Indonesia
 Ireland
 Malaysia
 Mexico
 Panama
 Peru
Peru
 Philippines
 Singapore
 South Africa
 Sri Lanka
 Thailand
 United Kingdom
 United States


