Canada (English)
 Colombia
 Caribbean and Puerto Rico
 Ecuador
 India
 Indonesia
 Ireland
 Malaysia
 Mexico
 Panama
 Peru
 Philippines
 Singapore
 South Africa
 Sri Lanka
 Thailand
 United Kingdom
 United States
 AcumatiCares


What are the Essential Manufacturing KPIs?
Manufacturing KPIs help teams evaluate production output, costs, quality, and delivery performance. The most useful measures connect daily operations to specific business goals, such as reducing rework, controlling production costs, or delivering customer orders on time.
Choose a manageable set of KPIs for each role, with clear definitions, reporting periods, and ownership. A production supervisor may need shift-level throughput and quality measures, while an executive may focus on broader cost and revenue trends. The following eight metrics provide a starting point.
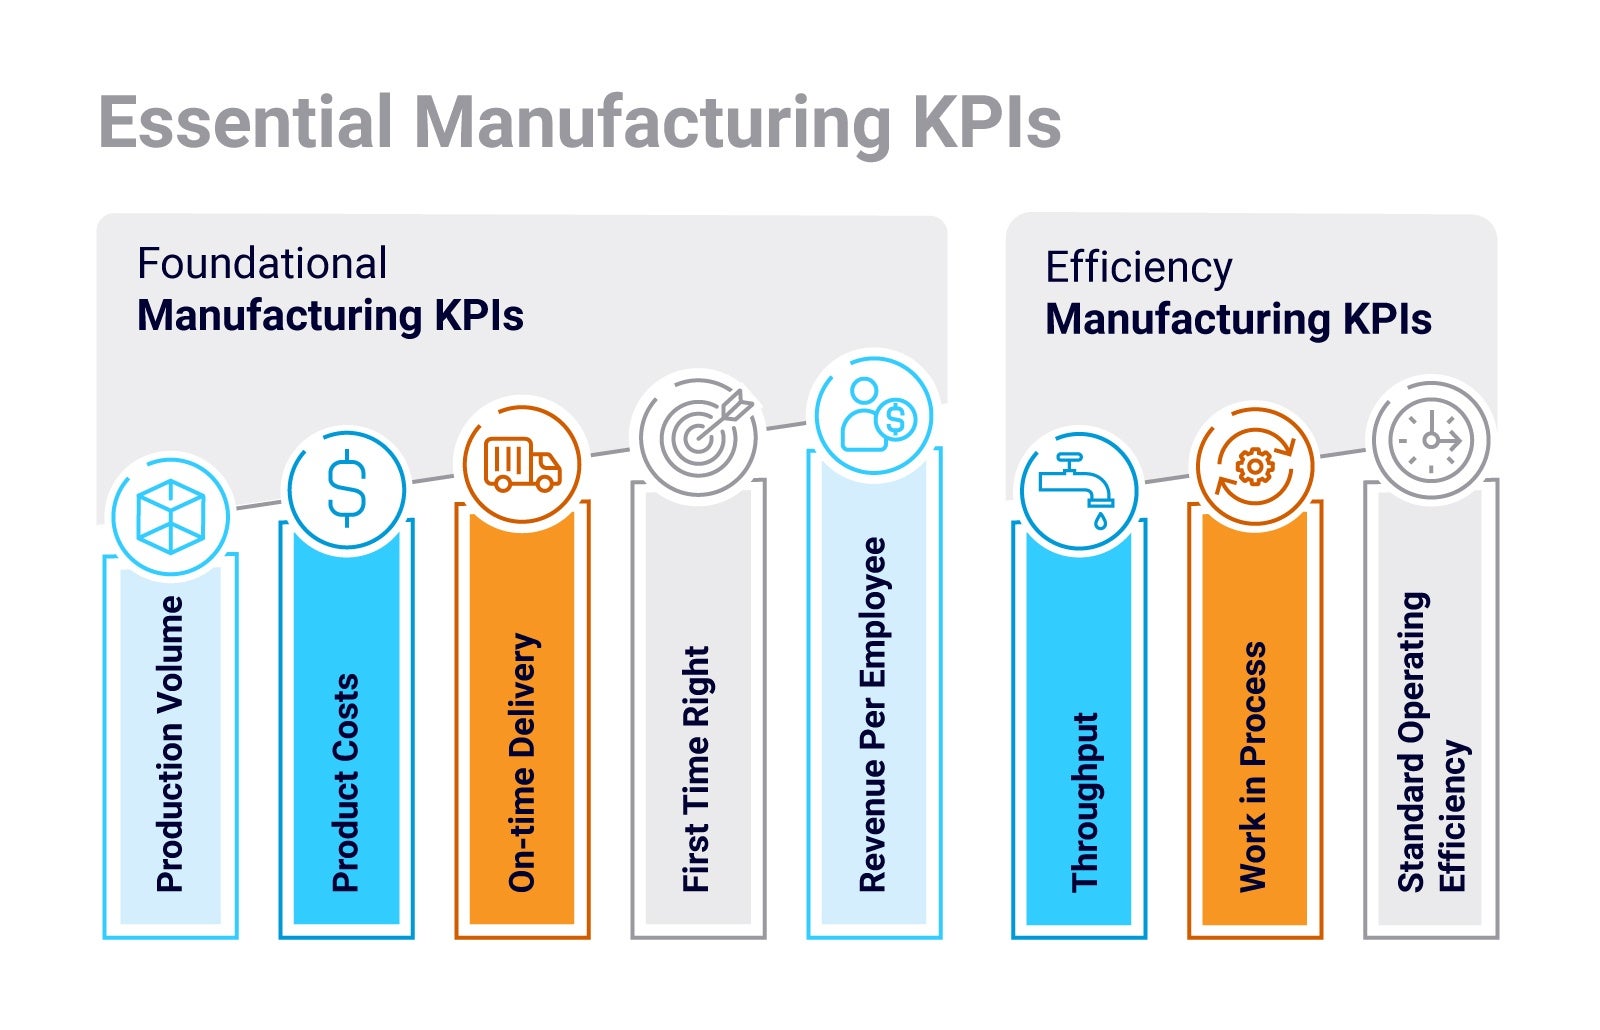
Foundational Manufacturing KPIs
1. Production Volume
Production volume measures the number of units completed during a defined period, such as a shift, week, or month. Specify whether your count includes all completed units or only units that meet quality requirements.
Formula: Production volume = Total units completed during the reporting period
Example: A production line completes 2,400 accepted units during one week. Its weekly production volume is 2,400 units.
Compare similar products and reporting periods, accounting for differences in product mix and available production time. Higher volume supports business performance when it meets demand without creating excess inventory or compromising quality.
2. Production Cost per Unit
Production cost per unit measures the manufacturing cost attributable to each unit produced. Include direct materials, direct labor, and allocated manufacturing overhead, using a consistent costing basis for both costs and output.
Formula: Production cost per unit = Manufacturing costs attributable to the output ÷ Units produced
Example: Manufacturing costs of $120,000 for 6,000 units result in a production cost of $20 per unit.
Track this measure by product or product family to make comparisons meaningful. When costs change, investigate material prices, labor usage, scrap, and overhead allocation to understand the cause.
3. On-Time Delivery
On-time delivery measures the percentage of orders delivered by the agreed customer delivery date. Calculate it using all orders due during the reporting period, including those that remain overdue and undelivered.
Formula: On-time delivery (%) = (Orders delivered by the agreed date ÷ Total orders due during the period) × 100
Example: Of 100 orders due during a month, 92 arrive by the agreed date. On-time delivery is 92%.
Define which promised date you use, how delivery is confirmed, and how partial deliveries are treated. If you can track dispatch dates but cannot confirm customer receipt, report on-time shipment as a separate measure.
4. First-Pass Yield: Measuring First-Time-Right Production
First-pass yield measures the percentage of units that meet quality requirements on their first pass through a defined process, without rework. Units that require correction before acceptance do not count as first-pass successes.
Formula: First-pass yield (%) = (Units passing without rework ÷ Total units evaluated on their first pass) × 100
Example: Of 1,000 units evaluated, 950 meet quality requirements without rework. First-pass yield is 95%.
Measure first-pass yield by operation, production line, or product to identify where quality losses occur. Keep the process boundary and inspection criteria consistent so that comparisons reflect actual changes in performance.
5. Revenue per Employee
Revenue per employee measures revenue relative to the organization’s average workforce size. Using full-time-equivalent employees, or FTEs, provides a consistent basis when the workforce includes part-time employees.
Formula: Revenue per employee = Revenue for the period ÷ Average FTEs during the same period
Example: A manufacturer generates $12 million in annual revenue with an average workforce of 80 FTEs. Revenue per employee is $150,000 per FTE.
This is an organization-level measure. Interpret it alongside profitability, outsourcing, automation, and product mix rather than using it to assess individual employee performance.
Efficiency Manufacturing KPIs
6. Throughput Rate
Throughput rate measures how many good units a process completes per unit of time. It differs from throughput time, which measures how long work takes to move through a process.
Formula: Throughput rate = Good units completed ÷ Measured production time
Example: A line completes 480 good units during an eight-hour shift. Throughput is 60 good units per hour.
Specify whether the time period includes the entire shift or only operating time, and measure output at a consistent process boundary. Increasing one machine’s output may not improve finished-goods throughput if another operation limits overall production.
7. Work in Process (WIP)
Work in process is inventory that has entered production but is not yet complete. Monitoring its quantity, age, and location helps teams understand where unfinished work is accumulating.
Measurement: WIP quantity = Units in production that remain incomplete at the measurement point
Example: At the end of a shift, 350 units remain unfinished, including 80 waiting at one operation.
Increasing or aging WIP can signal a need to investigate queues, material shortages, or production imbalances. WIP alone does not establish efficiency or prove that a bottleneck exists. Track its financial value separately using your established costing method.
8. Labor Efficiency
Labor efficiency compares the standard labor hours allowed for completed output with the actual direct labor hours used. Standard hours earned represent the time that the completed work should require under established labor standards.
Formula: Labor efficiency (%) = (Standard labor hours earned ÷ Actual direct labor hours used) × 100
Example: Completed output earns 180 standard labor hours but requires 200 actual direct labor hours. Labor efficiency is 90%.
Use consistent rules for recording time and calculating standard hours. Review labor standards when products or processes change, and assess efficiency alongside quality and delivery performance to ensure that faster production supports broader business goals.
Example: Manufacturing KPIs
(this is a hypothetical example)
A manufacturer increases weekly production from 2,000 to 2,300 units, but first-pass yield falls from 97% to 91% and on-time delivery declines. Production volume alone suggests improvement, while the other KPIs reveal a potential trade-off.
The operations team should investigate where defects, rework, and delays are occurring before increasing output further. Reviewing these measures together helps determine whether higher production is improving customer service and profitability or creating additional work.
This hypothetical example illustrates why manufacturing KPIs should support a shared business objective. Improving one measure can create problems elsewhere if teams overlook its effect on the rest of the operation.