
-
English
-
English
-
 AcumatiCares
 Canada (English)
 Colombia
 Caribbean and Puerto Rico
 Ecuador
 India
India
 Indonesia
 Ireland
 Malaysia
 Mexico
 Panama
 Peru
Peru
 Philippines
 Singapore
 South Africa
 Sri Lanka
 Thailand
 United Kingdom
 United States


Product
ERP Reporting, Dashboards and Business Intelligence Software
Turn your ERP data into actionable insights with advanced reporting, intuitive dashboards, and powerful BI—enhanced by built-in AI. Give teams role-based visibility into KPIs, trends, anomalies, and the underlying transactions behind business performance.
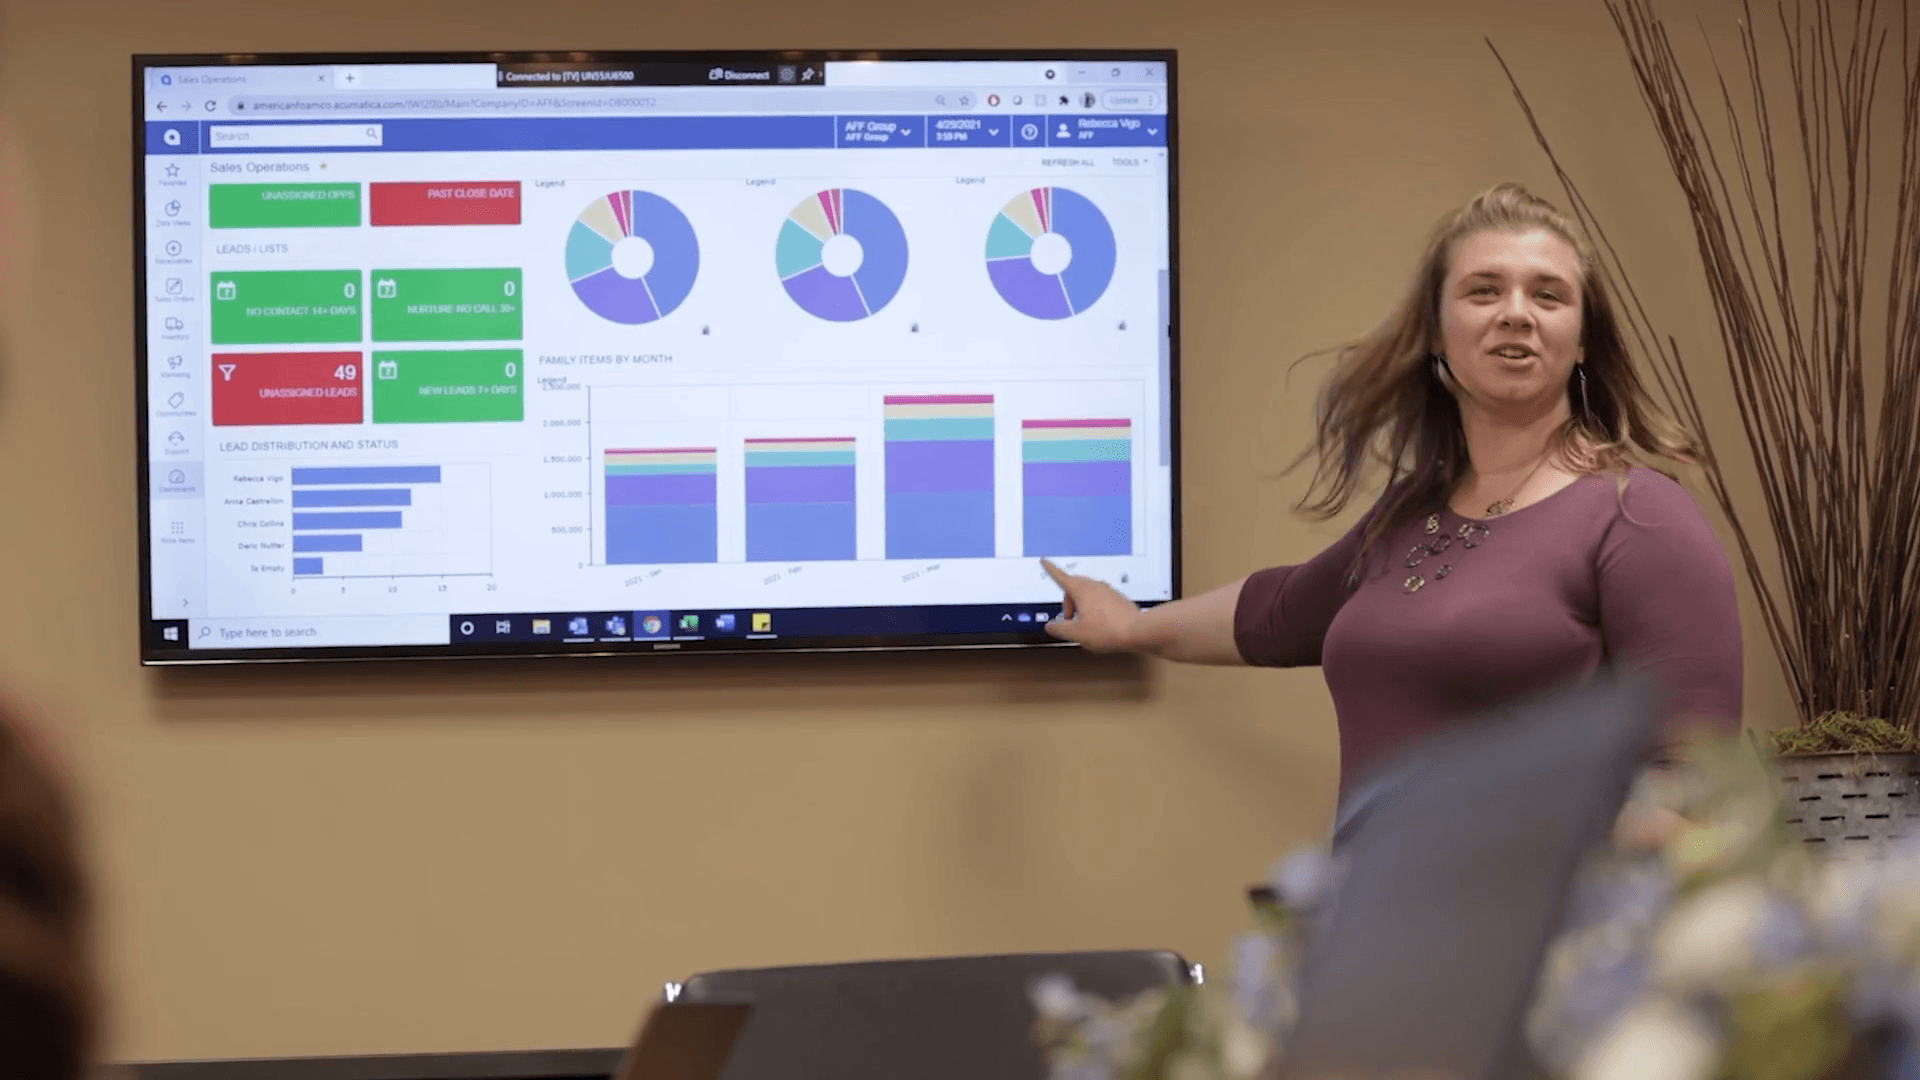
Empower your teams with intelligent reporting and data insights
Unify business data and give teams role-based access to dashboards, reports, and drilldown analysis. Built-in AI helps surface anomalies and important trends, while flexible reporting tools let users move from high-level KPIs to the underlying transactions that explain performance.
Designed for flexibility
click icon to learn more
Product highlights
Give teams a clearer view of performance with flexible reporting, customizable dashboards, business analytics, and AI-assisted anomaly detection. Extend financial analysis with familiar tools such as Excel while keeping data connected to Acumatica.
Dashboards
Reports and inquiries
Business analytics
Manage by exception
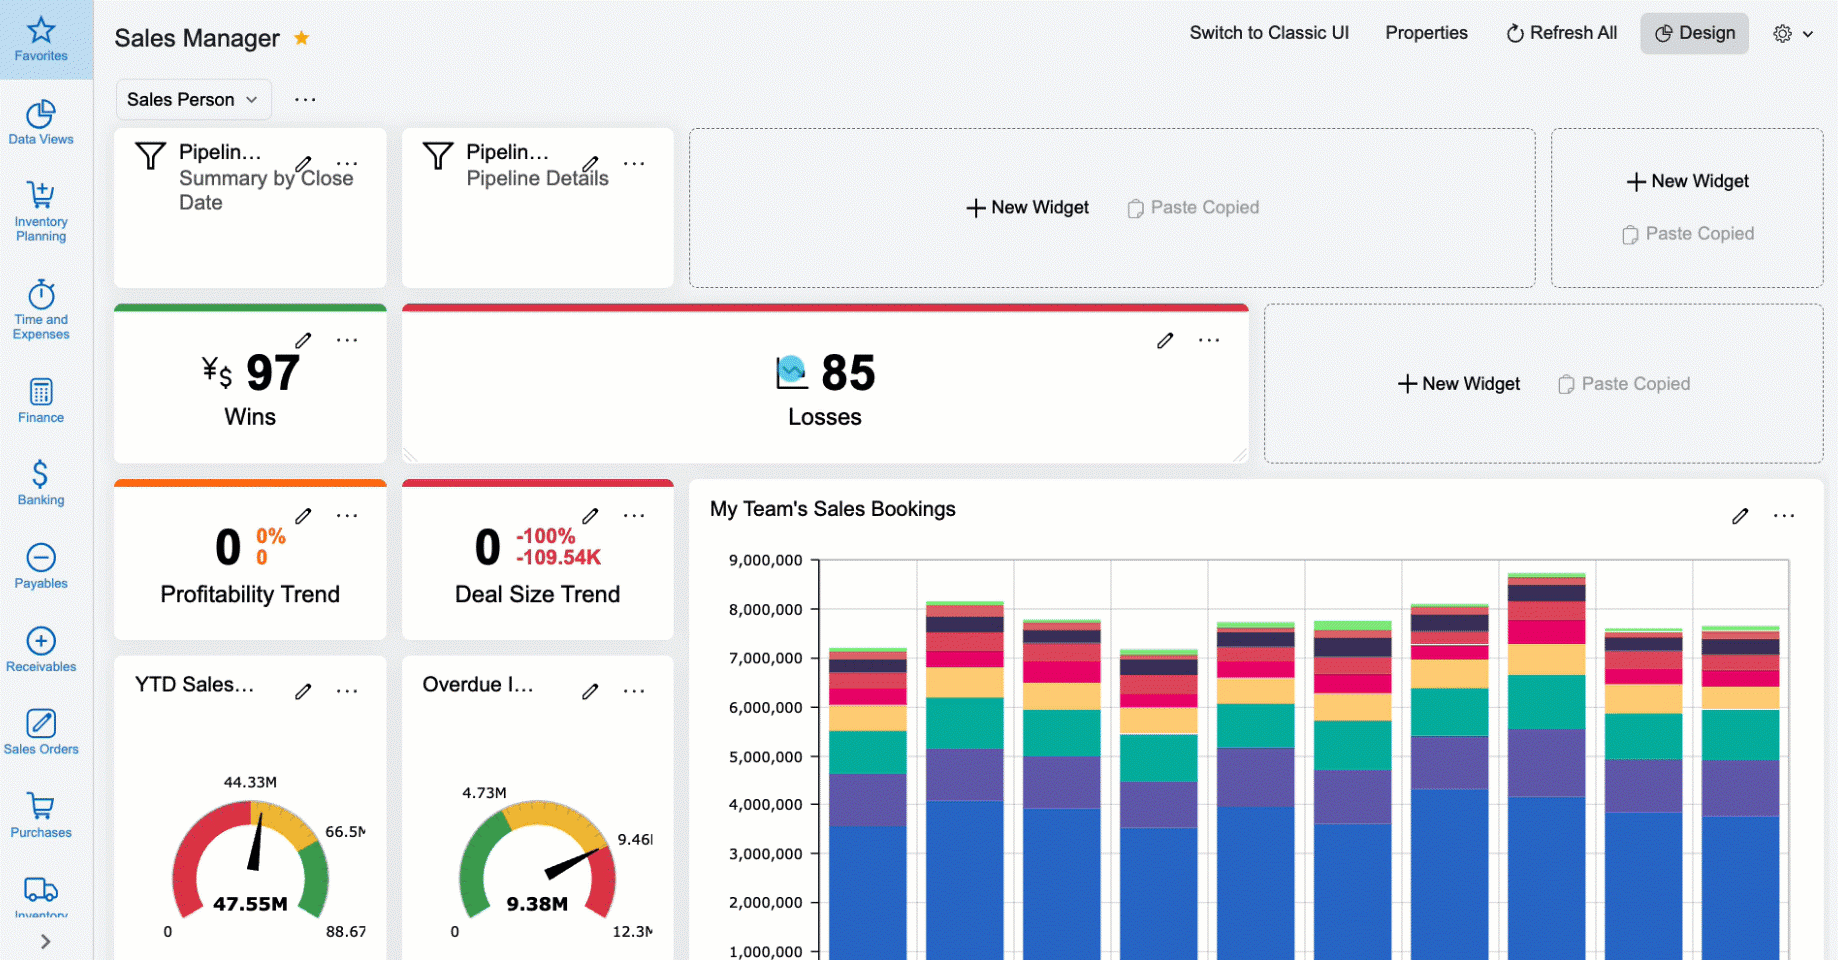
Dashboards
Deliver interactive, role-based visibility into real-time KPIs.
Build personalized dashboards by role, department, or function to monitor real-time KPIs and business performance. Turn an AI Assistant answer into a dashboard widget in a click. Use charts, tables, meters, and status indicators to highlight what matters, then drill down from dashboard metrics into supporting details and transactions.
Reports and inquiries
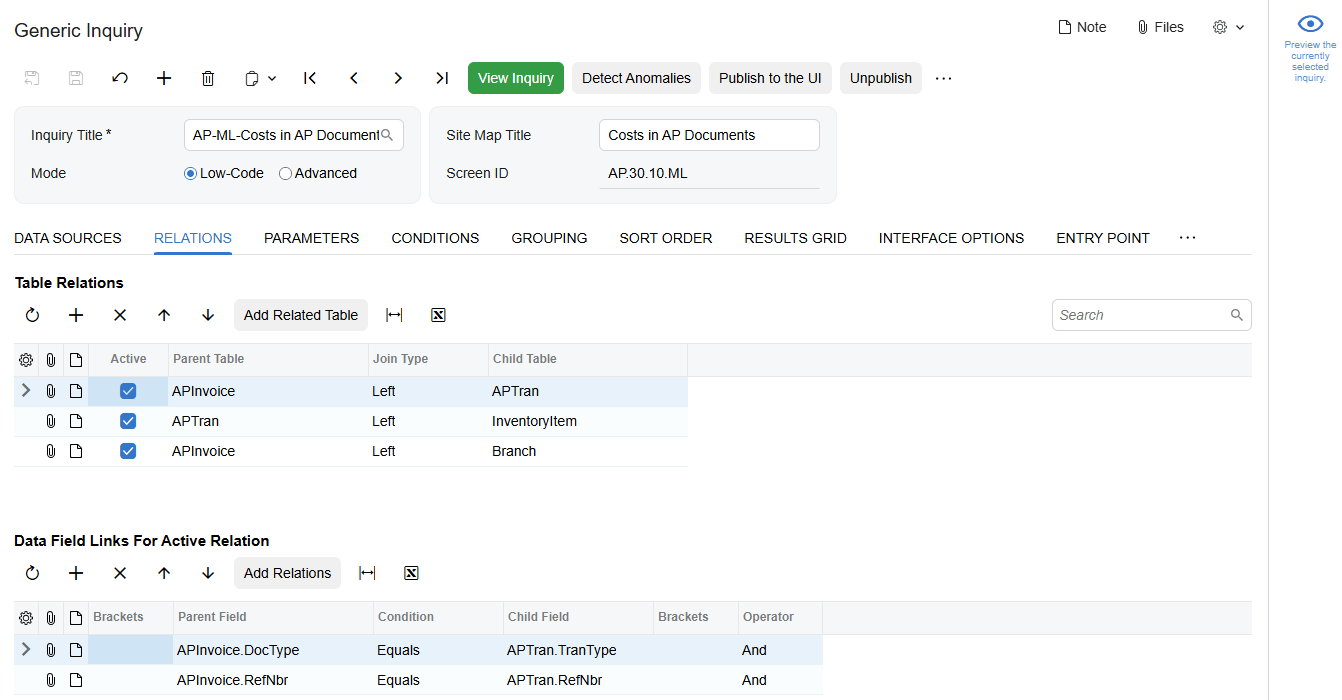
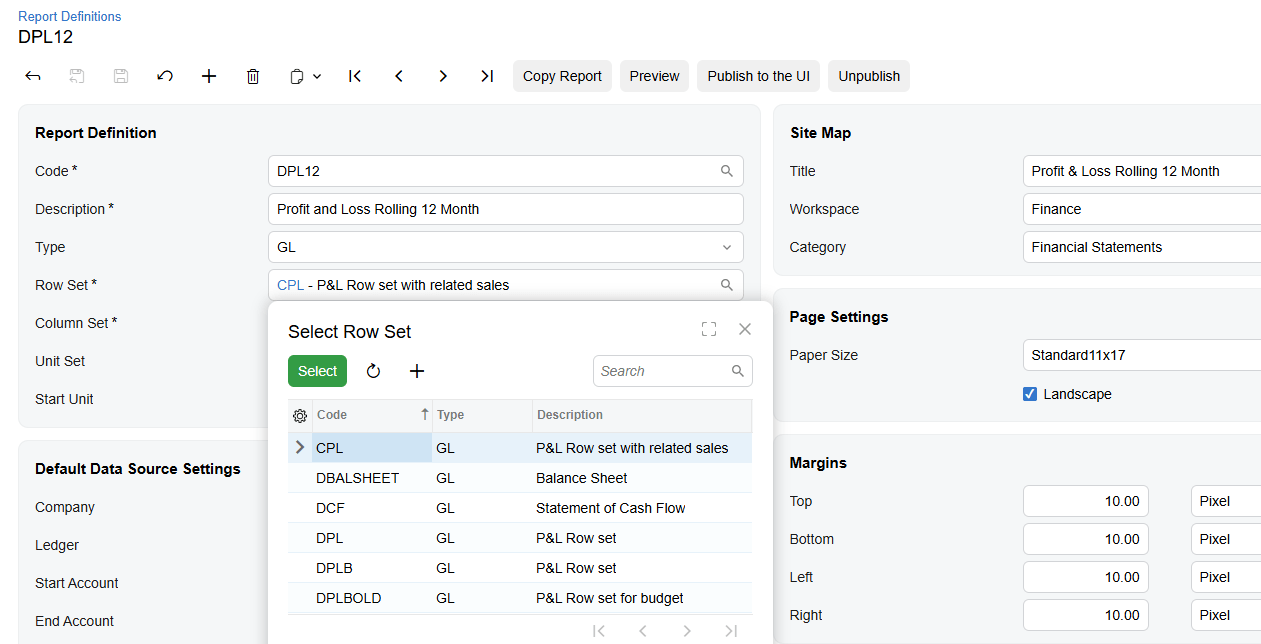
Answer questions faster with flexible reports.
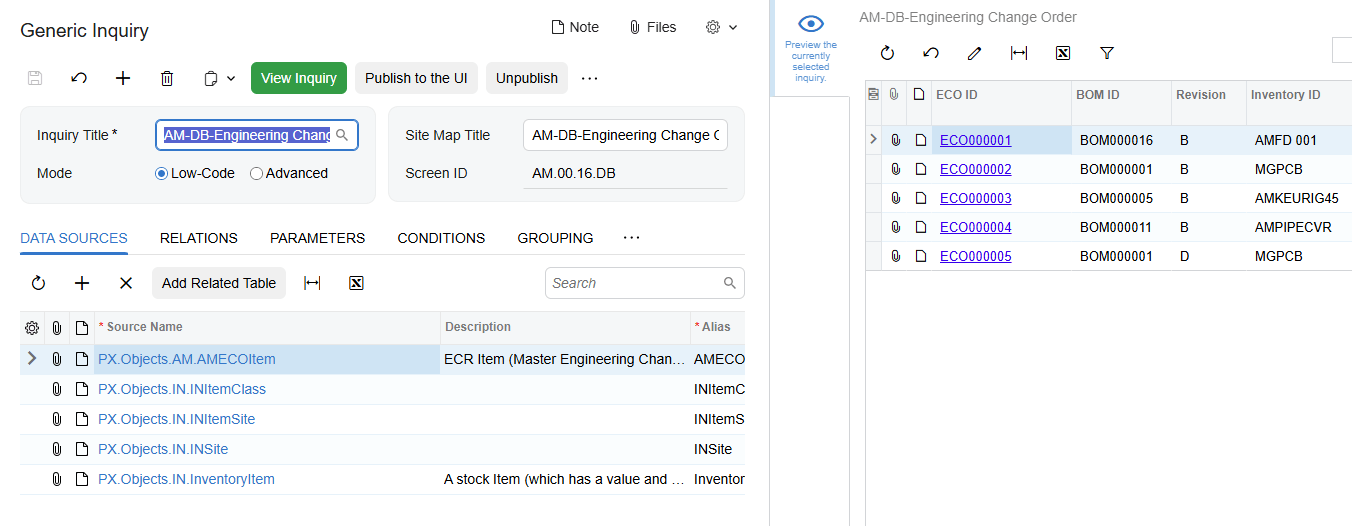
Create reports and Generic Inquiries using current Acumatica data, then share results through reports, dashboards, Excel, or OData. Filters, pivot tables, side panels, and drilldowns help users move from summary information to the details needed for analysis. Organize Generic Inquiry results into a Grouped Table view with nested groups, subtotals, and totals — no need to rebuild the inquiry in Report Designer — and restrict which data access classes are available while designing inquiries, so business users can build their own without exposure to data outside their permissions.
Business analytics
Connect data sources and uncover trends with modern business intelligence tools.
Aggregate data across systems and analyze it with tools like Microsoft Power BI for richer, interactive business intelligence and analytics. Use natural language-style querying to explore performance questions and accelerate discovery. Enhance insight with advanced anomaly detection on nested generic inquiries to spot outliers sooner and respond before small issues become big ones.
Manage by exception
Focus attention on what needs action with alerts, anomalies, and exception-driven workflows.
Highlight KPIs, thresholds, and unusual patterns that may signal risk or opportunity. Anomaly detection, drilldowns, and event-driven notifications help teams investigate root causes and focus attention on the conditions that need action.
Why Acumatica for reporting and analytics?
A scalable solution that grows with your business.
Customizable and flexible application
Learn more
Consumption-based licensing
Learn more
Enterprise-grade security
Learn more
Build your perfect demo
Select the videos that are most relevant to your dashboards, reporting, and BI needs.
Acumatica Overview
Reporting, Dashboards, and BI
Artificial Intelligence Strategy
General Ledger and Financial Reporting
Raubex Success Story
Reporting, Dashboards, and BI knowledge center
Your ultimate toolkit for modernizing operations.
What's new
Integrations
Resources
ROI calculator

What’s new in 2026 R2 for reporting and BI?
Get answers faster and keep growing inquiries running smoothly with performance upgrades, more flexible report layouts, and tighter control over who can see what.
- Turn any AI Assistant answer into a dashboard widget in a click, then drag it straight onto any dashboard.
- Speed up large or frequently used generic inquiries by storing their results in a dedicated data warehouse table, so they load instantly instead of recalculating every time.
- Organize generic inquiry results into a grouped table view with nested groups, subtotals, and totals — no need to rebuild the inquiry in Report Designer.
- Restrict which data access classes are available while designing generic inquiries, so business users can build their own without exposure to data outside their permissions.

Marketplace solutions for reporting, dashboards, and business intelligence
Explore resources on reporting, dashboards, business intelligence, analytics, and data-driven decision-making.

Resources
Learn more with these resources for reporting, dashboards, business intelligence, and more.

ERP ROI calculator
Calculate the potential business impact of a connected ERP solution.
FAQ
What is ERP Reporting Software?
ERP Reporting Software helps businesses turn operational and financial data into reports, dashboards, and analysis that support decision-making. It can give users access to current KPIs, trends, transactions, and business performance without relying on separate data sources or manual reporting processes.
Can Acumatica create real-time dashboards?
Yes. Acumatica supports role-based dashboards that display real-time KPIs using charts, tables, meters, and other visual elements. Users can drill down from dashboard metrics into supporting data and transactions for deeper analysis.
How does Acumatica handle reporting and ad hoc analysis?
Acumatica provides flexible reports and Generic Inquiries that can be filtered, analyzed with pivot tables, and shared through dashboards, Excel, OData, and other reporting outputs. This gives users multiple ways to explore business data without relying on a single reporting format.
Does Acumatica work with business intelligence tools like Power BI?
Yes. Acumatica can connect data with tools such as Microsoft Power BI for interactive business intelligence and analytics. Organizations can combine Acumatica data with information from other systems to analyze trends and performance across the business.
How does Acumatica use AI in reporting and analytics?
Acumatica uses AI-assisted capabilities such as anomaly detection to identify unusual patterns and outliers in business data. Teams can combine those insights with dashboards, inquiries, drilldowns, and alerts to investigate issues and act on changing conditions.
Can different teams have their own dashboards and reports?
Yes. Dashboards can be configured by role, department, or business function so users see the KPIs and information most relevant to their responsibilities. Reporting and inquiry tools also support filters, permissions, and different views of the same underlying business data.





Building the future of business, together.
Turn ERP data into clearer insights with connected reporting, dashboards, and business intelligence tools from Acumatica.